
Following the guidelines Alternative Performance Indicators which were prepared in 2015 by the European Securities and Markets Authority, and which came into force 3 July 2016, the company presents the definitions of the used indicators and the calculation methodology.
AuM refers to the assets we manage or have under supervision and generally equals to the sum of the following: fair value of managed or supervised assets and uncalled capital commitments. Fair value of managed or supervised assets is generally based on one of the following:
– the capitalization of listed entities;
– the net asset value of unlisted funds;
– the fair value of financial instruments of discretionary managed portfolios;
– the fair value or value set out in contracts of assets supervised by the family office.
The net asset value of feeder funds that invest in our managed funds is not included into AuM. The carry units of funds are included in AuM calculation. The reported amount is the aggregated, not consolidated, sum of the assets; therefore, assets which represent investments to our managed assets are included in the assets supervised by family office.
This AuM represents the size of assets to which the Group has an economic influence through management or supervision. We believe that such AuM stands as a better measure of our investment and fundraising performance.
Fee-earning AuM refers to the assets we manage or have under supervision and from which we derive recurring fees. Our Fee-earning AUM is generally based on one of the following, once fees have been activated:
– the amount of subscribed capital commitments of funds;
– invested capital of funds at cost;
– the net asset value of funds;
– net asset value before management fees of funds;
– the capitalization of listed entities;
– the fair value of financial instruments of discretionary managed portfolios;
– the fair value or value set out in contracts of assets supervised by family office.
If management fee is not applied to some classes of funds units, corresponding value of funds units is not included into Fee-earning AuM. The corresponding value of feeder funds that invest in our managed funds is not included into Fee-earning AuM (unless the value exceeds the corresponding fund value, in such case the excess is included).
Our calculations of AuM and Fee-earning AuM may differ from the calculations of other asset managers. As a result, these measures may not be comparable to similar measures presented by other asset managers. The terms used in the definition are not consistent with the terms how they are defined in the Regulatory framework. The definition ‘managed assets’ includes assets of managed funds as it is defined by the Regulatory framework as well as assets managed under a portfolio management delegation agreement and assets managed under property administration agreement. The term “funds” include not only funds without legal status, but also entities with legal status, including listed entities managed by the Invalda INVL group companies.
Return on Equity (ROE) – the last 12 months’ net profit and average equity ratio, expressed as a percentage. Ratio measures return attributable to shareholders and is useful when comparing the Group’s profitability to competitors.

Average Equity – an arithmetic average of the ending equity 12 months prior to the end of the reporting period and the equity at the end of reporting period.
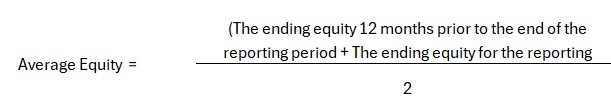
The calculation formulas for Return on Equity (ROE) and Average equity 30/05/2025 have been adjusted to incorporate data from the last 12 months, in order to ensure a more consistent assessment of profitability and a more accurate reflection of the period’s results.
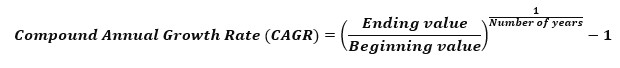
Compounded annual growth rate (CAGR)– The average annual growth rate of a company or investment over a certain period. The indicator shows the steady rate at which the investment would have grown each year if the growth rate had been consistent.
Book Value per share – The amount of the group’s equity divided by the number of shares at the end of the reporting period, excluding the group’s own shares. It shows the residual value to the shareholder after liquidating all assets and covering all liabilities.

Price to Book Value ratio (P/BV) – The ratio of the market price of shares at the end of the reporting period to the net asset value per share. It shows the ratio of the company’s market valuation to the equity attributable to shareholders.

Liquidity ratio – The ratio of current assets to current liabilities. Used to determine the ability of debtors to cover their current liabilities without attracting external capital.

Net margin – The ratio of net profit to sales expressed as a percentage. This indicator shows the ratio at which sales revenue is converted into profit.

Debt ratio – The ratio of total liabilities to total assets. This indicator shows what proportion of the company’s assets is financed by borrowed funds.

Debt to Equity ratio (D/E) – The ratio of total liabilities to equity. This indicator shows what proportion of the company’s activities is financed by borrowed funds and what proportion by shareholders’ equity. A higher ratio indicates a stronger dependence of the company on borrowed capital.

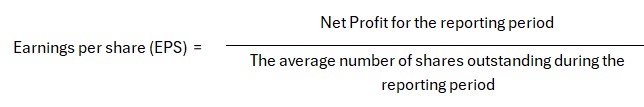
Earnings per share (EPS) – The ratio of net profit for the reporting period to the weighted average number of ordinary shares outstanding. This indicator shows how much of the company’s profit is attributable to one ordinary share. When evaluating this indicator, the rule is that the higher the value, the better.
Price to Earnings ratio (P/E) – The ratio of the share price at the end of the reporting period to net income per share (EPS). The indicator is used to compare a company with its own historical indicators or to compare markets with each other over a certain period.